Money market funds spring a leak after year of record inflows

Simply sign up to the Capital markets myFT Digest -- delivered directly to your inbox.
A sharp rise in interest rates has cranked up mortgage payments for consumers and escalated borrowing costs for companies around the world over the past 19 months. But it has also lifted the available yields on money market funds to their highest level in years — prompting investors to pour a record $1tn into the asset class since January.
The cascade this year, concentrated mainly in the US, has come in stages. Initially, it was spurred by the Federal Reserve firing the starting gun on rate rises — translating into much improved returns on money market funds, which typically hold short-dated assets, such as government debt. The inflows then accelerated in March and April as fears over the health of the banking sector pulled some investors away from their traditional deposit accounts.
However, even as these concerns eased, the inflows into money market funds broadly persisted, fuelled by expectations that the Fed will keep borrowing costs “higher for longer” before starting to cut them. Citing figures from data provider EPFR, strategists at Bank of America Securities now project record full-year fund inflows of $1.3tn.
This enthusiasm for money market funds has been driven by both institutional and private investors.
“Retail investors have been extremely attracted to the 5 per cent yield that they can get on a money-market fund and are putting more and more money into them,” says Shelly Antoniewicz, deputy chief economist at the Investment Company Institute, an association for investment funds, noting that inflows from this cohort were “split almost evenly between government and prime” funds.
Prime funds offer an even higher premium than Treasury-focused vehicles, because they also hold banks’ commercial paper, rather than purely ultra-safe Treasury bills.
But, despite overall inflows in the year to date, October marked a partial reversal of the tide, with $36bn leaving US money market funds on a net basis. That marked the biggest monthly decline since April 2022.

In the seven days to October 18 alone, more than $100bn was pulled out of US money market funds — the biggest weekly outflow on record, based on EPFR data going back to 2007.
But inflows picked up again in subsequent days, with $66bn coming in over the week to November 1. Analysts and investors concur that it is too early to draw firm conclusions about the drivers behind the earlier outflows, or view them as indicative of future moves.
Still, early signs of an outward trickle have sparked questions over the competitiveness of cash-based vehicles as higher interest rates start to drag up the yields on longer-dated assets. It has also fuelled debate over the risk of a small leak from money market funds turning into a torrent.
The outflows in October stemmed primarily from institutional investors, Antoniewicz notes. One likely reason for the withdrawals, she suggests, was that extended payments for US corporate taxes came due in mid-October. Many organisations use money market funds as a place to park their operating cash.
However, Elyas Galou, an investment strategist at BofA Securities, notes that the withdrawal was “quite unusual”.
“Typically, there is a seasonality in money market fund flows,” he points out, meaning that “at the end of each quarter, we may record very large inflows or outflows”. But this “was not an end-of-quarter flow”. While “the data is very volatile” and the drivers of the outflows are still unclear, Galou thinks it was possible that investors were starting to reallocate some of their funds away from money market vehicles.
Short-term debt has been particularly appealing since the Fed started raising rates because of the unusual scenario of an “inverted yield curve” — whereby bonds at the front-end of the Treasury curve yield more than longer-dated assets.
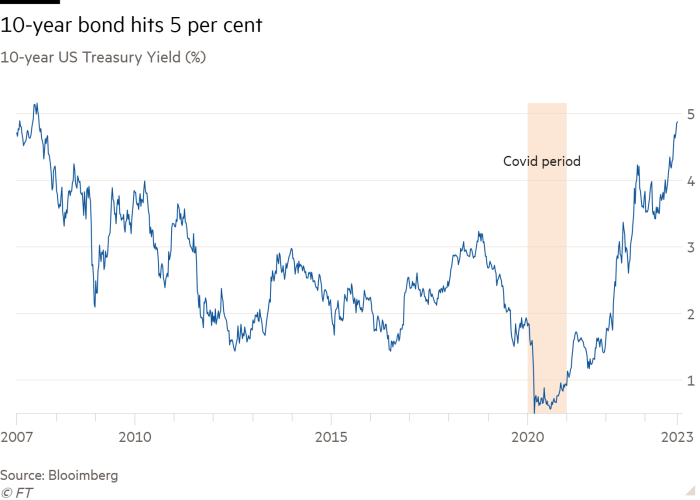
More recently, though, pressure on longer-dated government paper took the benchmark 10-year US government bond yield above 5 per cent in October, reaching its highest point since 2007.

John Tobin, chief investment officer at Dreyfus, notes that “we’ve certainly seen more sophisticated investors — hedge funds, real money players — extending duration on their own by taking money from the front end, either out of bank deposits or money market funds, and going into the direct markets, like Treasury bills or agency debt”, with a view to locking in yields for some time.
In response, Dreyfus itself is “extending duration to hold on to yields for as long as we can” within money market funds, explains Tobin, so that “money funds’ yields are going to look great versus direct markets in a rate-cutting environment”.
However, at the same time, there is still a rivalry between money market funds themselves — despite the vehicles all broadly offering much better returns than they did a couple of years ago.
“We thought there’d be more flexibility now that we’re paying well over 500 basis points, but that competitiveness is still there,” says Tobin.
Still, he adds, as far as broader reallocation goes, many companies need to keep cash in the vehicles for funding purposes — and such cash is “very risk averse”. “Things like equities would not be an option for them,” he says.
Deposit rates could pose more of a challenge to money market funds if banks remain aggressive in terms of what they can pay out to investors. But, overall, Tobin says the risk is “very, very low” of “money pouring out” or a “drawdown in the money market fund universe”.

Comments