Can rate cuts and quantitative tightening mix?

Simply sign up to the Central banks myFT Digest -- delivered directly to your inbox.
This article is an on-site version of our Chris Giles on Central Banks newsletter. Sign up here to get the newsletter sent straight to your inbox every Tuesday
Ahead of the latest US consumer price data, it has been yo-yo time at the world’s two leading central banks. After spending most of February and early March telling markets it was too early to talk about interest rate cuts, the message reversed in the past week.
European Central Bank president Christine Lagarde suggested that a eurozone interest rate cut would come in June. Not to be outdone, Federal Reserve chair Jay Powell also indicated the Fed was “not far” from having the confidence to cut rates. Again, June is the most likely month. If these views firm, it will be the ECB that will be first to act (its decision comes on June 6 compared with June 12 for the Fed).
This raises the question of whether rate cuts and quantitative tightening can be happy bedfellows. Let’s take stock of what we know about QT. What do you think? Email me: chris.giles@ft.com
A global primer on the future of QT
Central bankers love acronyms. And when it comes to talking about buying and selling assets, they are really smitten. Apart from quantitative easing and tightening, people have to get their heads around the APF, the PEPP, the APP, IORB, ON RRP and the SRF — and that is just a subset of terms flung around by the Bank of England, European Central Bank and the Federal Reserve. I’m going to lay out as simply and briefly as possible the progress made so far and the challenges to come across the world.
Remember, QT is the process of carefully selling assets that central banks hold back to the private sector and then destroying the money they receive in return. It is the reverse of QE and has been going rather well so far.
Why is there active and passive QT?
All central banks selling assets engage in passive QT. That means that they receive money when the bonds they hold mature, they do not buy new assets with the money and instead destroy it. Some central banks, such as the Fed and ECB, put a limit on the amount of passive QT they undertake each month, so they do use some of the money they receive to purchase new assets. These limits ensure an orderly pace for QT.
Three countries have also engaged in active QT where they sell assets back to private investors before they mature. Sweden and New Zealand do this primarily because their countries’ have very little public debt, so the sums involved are objectively small. The UK has also started active QT because its public debt is much longer-dated than most other countries. If the BoE waited for assets to mature, it would be hanging around a very long time.
There is nothing more complicated than that in explaining the QT choices internationally, as the chart on countries’ debt profiles below shows.

What progress is QT making globally?
A lot has been achieved, but much more is still to come. As I described last week, QT appears to be progressing as well as central banks could hope. Sweden, New Zealand and Canada have made the most progress in reversing the pandemic-related QE. Rather less progress has been made elsewhere, especially in the mega economies of the US and eurozone.
If current run-off rates are continued, the smaller economies will largely reverse QE, but half of the assets bought globally during the pandemic will still be held by central banks at the end of 2025. We need, therefore, to be cautious in overpraising QT. It has a long way to go. The simulations shown in the chart below are from the paper by Du, Forbes and Luzzetti.

Where is QT already slowing?
Canada has announced it is likely to stop QT later this year because the stock of assets will be down to 1 to 2 per cent of gross domestic product. The US is beginning also to make noises about a wind down in the speed of passive QT run-off. Lorie Logan, head of the Dallas Fed, has talked about “slowing” but not stopping QT relatively soon in the US, so the central bank can feel its way to the right level of assets in a world where commercial banks want more liquid assets than in the past.
Christopher Waller, a governor of the Fed, pointed out earlier this month that the US central bank had already said it would “discuss slowing our redemptions at our FOMC meeting this month”. That means next week. He stressed that the question would be what is the right size of the Fed’s balance sheet to make the financial system work rather than what pace of QT chimes with its interest rate policy.
Outside the US and Canada, there have been no moves elsewhere to slow the pace of QT so far.
How far can QT go?
This is the big and difficult question. To ensure they can meet customer needs for funds, commercial banks will want to hold more liquid assets than before the global financial crisis, but no one knows for sure how much. When the Fed was undertaking QT between 2017 and 2019, it ran into trouble with market short-term interest rates spiking well above the Fed’s target range, indicating it was not supplying enough liquidity to meet the banking system’s needs.
Central bankers are therefore watching money markets carefully for similar spikes (which suggest that banks are short of overnight funds and are willing to pay significantly more than the official rate to get them). Of course, not all banks will hit that constraint at the same time, so both the Fed and BoE have put in place new facilities so that banks can swap other high quality assets such as government bonds for central bank money. They hope that this will alert them about stresses emerging in the financial system.
By far the best explanation of these new tools came in a speech last year by the Reserve Bank of Australia’s Andrew Hauser (who was then at the BoE). The following chart explains both the BoE and Fed’s current thinking. This applies even though the two central banks do not have exactly the same sort of floor system for setting interest rates.

At the ECB, thinking has not progressed in the same way, partly because it has sold fewer assets, partly because it uses different mechanisms to set interest rates and partly because it is reviewing that system. Isabel Schnabel, a member of the executive board of the ECB, said in December that she wanted commercial bank demand for central bank money primarily to drive the size of the central bank’s balance sheet and saw no problem with this being potentially different from the Fed’s system of setting short-term interest rates. It will set out its policy on Wednesday.
What else should I be looking out for?
Remember the Fed’s “operation twist” in 2011? No one can blame you for forgetting. That was when officials bought long-dated Treasuries in place of short-dated ones it already held, in a bid to lower long-term interest rates. Well, this might well go into reverse. The Fed’s Waller made it clear this month he was not keen on the Fed owning so many longer-dated assets and if it swapped them for short-dated ones, it would “allow our income and expenses to rise and fall together as the FOMC increases and cuts the target range”. Let no one say that officials do not care about central bank profits and losses.
In the same speech, Waller also suggested the Fed should gradually sell all of its mortgage-backed securities. That would move it closer to the position of other central banks.
What about Japan?
In the land of the rising sun, no one is talking about QT yet. The Bank of Japan has been buying assets at a quite remarkable pace since 2001. In the latest guise of yield curve control, the pace of asset purchases has slowed significantly, but government bonds are still being bought and the central bank owns more than half of the government securities issued — as the chart below shows.

What I’ve been reading and watching
My economics colleagues have expertly summarised the recent change of tone from the Fed, ECB and BoE and they are almost declaring victory over high inflation, even as some data turns a little ugly
Kana Inagaki and Robin Harding dissect the latest noises from the Bank of Japan and predict it will end negative interest rates (but not QE) soon
Fear and loathing seems to be amplifying at the ECB. This time over climate change
In global economics, the Nobel laureate Angus Deaton takes a wholly reasonable stance on the discipline. Unfortunately, he labels some widely held and pretty orthodox views as “rethinking my economics”, earning a choice rebuke from former Obama adviser Jason Furman on X
Martin Wolf nails the problem with the Chinese economy. It is now far too big to export its savings surplus any longer
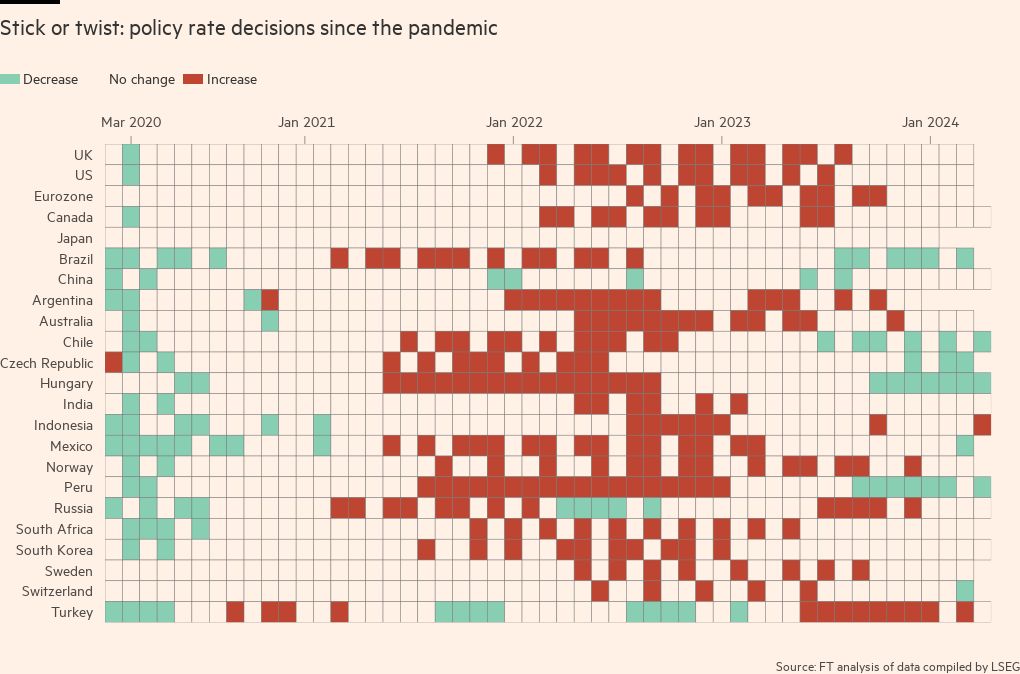
A chart that matters
The FT has updated its global inflation tracker, a real feast for data hounds. If you want to know a country’s inflation rate or interest rate or the components of its inflation, this is the place to go. In the chart below, you can see that the period of rate rises appears to be over, globally, and we are now beginning a period of rate cuts.

Comments