Investors pump $126bn into ETFs in March

Simply sign up to the Exchange traded funds myFT Digest -- delivered directly to your inbox.
Latest news on ETFs
Visit our ETF Hub to find out more and to explore our in-depth data and comparison tools
Investors pumped an outsized $126.5bn into exchange traded funds in March as a series of markets from Wall Street to gold hit record highs, according to data from BlackRock.
The buying spree was the third-strongest monthly figure since 2021 — beaten only by a surge in inflows in the final two months of 2023.
And even beyond the punchy headline reading there were further signs of bullishness with flows to equity ETFs at $96.6bn accounting for the vast majority of the tally.
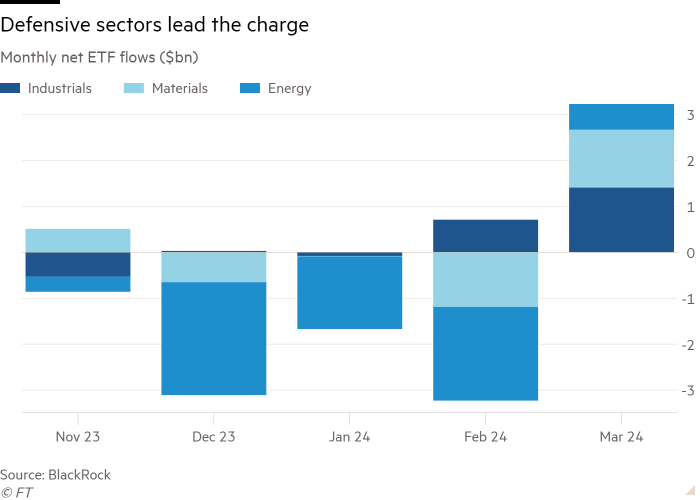
Sector ETFs investing in industrials led the way in March with net inflows of $1.4bn, their strongest showing since July 2023, followed by materials ($1.3bn) and energy ($600mn), sectors that are regarded as cyclical, highly dependent on the business cycle.
In contrast, $600mn was pulled from technology, the first time since October the sector has not led flows and its first month of net outflows since June. ETFs investing in healthcare, an intrinsically defensive sector, also flipped into outflows of $700mn.
“The investor enthusiasm that we saw very evidently in markets in March was captured in ETF flows,” said Laura Cooper, senior macro strategist for iShares in the Emea region at BlackRock.
However, the sector rotation “below the surface” may prove to be a greater indication of a swing in sentiment.
“Over the past several months we have seen a defensive tilt in equity buying. Now, what we are seeing is investors taking on more exposure to cyclical sectors,” Cooper said.
“It’s reflective of the broadening out of the rally that we are seeing in all financial markets,” amid resilient economic growth, especially in the US, despite higher interest rates.

“We saw tech continue to lead buying in 2023, so positioning there is quite saturated,” Cooper added. “We have not seen significant selling, but a rotation into industrials, materials etc, where there is potential for more growth uplift.”
Todd Rosenbluth, head of research at VettaFi, a consultancy, saw a similar picture. VettaFi’s own data suggests that the Industrial Select Sector SPDR Fund (XLI) saw inflows of $829mn in March, the Materials Select Sector SPDR Fund (XLB) $574mn and the Energy Select Sector SPDR Fund (XLE) $494mn, reversing the past year’s selling in the case of the latter two.
However, the Health Care Select Sector SPDR Fund (XLV), saw outflows of $150mn.
“We are seeing interest in sectors outside technology,” said Rosenbluth. “There is a general hope and perception that the market has broadened out,” rather than simply being led by the so-called Magnificent Seven tech-related stocks.
“We have seen greater confidence in the US economy. For some of these more cyclical sectors, that is a very positive sign for earnings growth.”
Matthew Bartolini, head of SPDR Americas research at State Street Global Advisors, believed the procyclical switch was logical.

“With no [US] recession in sight and US equity markets hitting 22 new all-time highs [in the first quarter] the lack of defensive positioning makes sense,” Bartolini said.
Referring purely to US-listed, rather than global, ETF flows, he added “utilities now lead outflows in 2024, while consumer staples and healthcare have the most outflows over the past year”. He said investors had “shunned defensive sectors as the economy remained resilient”.
The broadening of ETF investors’ equity market enthusiasm was further evidenced by flows into European small-cap funds hitting a record high of $600mn in March, representing a chunky 18 per cent of all European equity ETF flows.
Cooper believed this buying was “largely a question of valuations”, with European small-cap stocks currently trading at a 23.6 per cent discount to their average over the past five years (based on forward price-earnings multiples), according to BlackRock.
In contrast, US small-caps currently trade at a 13.7 per cent discount, while European large-caps are at a discount of 7.3 per cent and US large-caps a premium of 4.2 per cent, Cooper said.
Capping off the nascent signs of a shift towards a cyclical tilt, ETFs targeting cheaper “value” stocks enjoyed their highest inflows since August 2023, of $1.3bn.
Bartolini also noted some interesting equity wrinkles from SSGA’s US-only data. Although US equities soaked up the vast majority of inflows, developed market ex-US ETFs attracted $5bn in March, a record 45th consecutive month of net buying, he said.
Meanwhile, the renewed strength of the dollar would appear to be behind currency-hedged ETFs taking in $2.3bn, equivalent to 11 per cent of their assets at the start of March.

Simultaneously, emerging market ETFs pulled in $1.8bn, with 110 per cent of these flows ($1.9bn) being directed to funds that exclude China: those that do include the country witnessed small outflows.
Away from equities, commodity ETFs notched up their first month of inflows since May 2023, with $1bn of net buying.
This was entirely accounted for by silver ETFs, while gold funds continued to haemorrhage money, with a further $400mn of outflows cementing their 10th consecutive monthly outflow despite the fact that the gold price hit a series of record highs.
Cooper attributed the demand for silver — which was entirely from European investors — to hopes for “a catch-up to the gold price”, given that the ratio of the gold price to that of silver is trading at one of its highest levels of the past 10 years.
Comments