Pandemic crisis: Global economic impact tracker
Simply sign up to the Coronavirus economic impact myFT Digest -- delivered directly to your inbox.
After easing restrictive lockdown measures over the summer, the coronavirus is surging again around the world and has already caused the most severe global economic contraction since at least the 1930s.
Economic activity had started to recover where lockdowns eased, but now faces headwinds from new restrictions as case counts climb. Because there is a lag of weeks to months between when official economic data is produced and the period of time it covers, it is out of date before it is published.
The FT is tracking the most relevant alternative indicators to provide an early view of changes in activity as they happen across key sectors and countries. As well as regular updates to the charts, new indicators will be added as they become available.
LATEST FEATURES ADDED:
July 31: Added air traffic data from Flightradar24
CONSUMER SPENDING
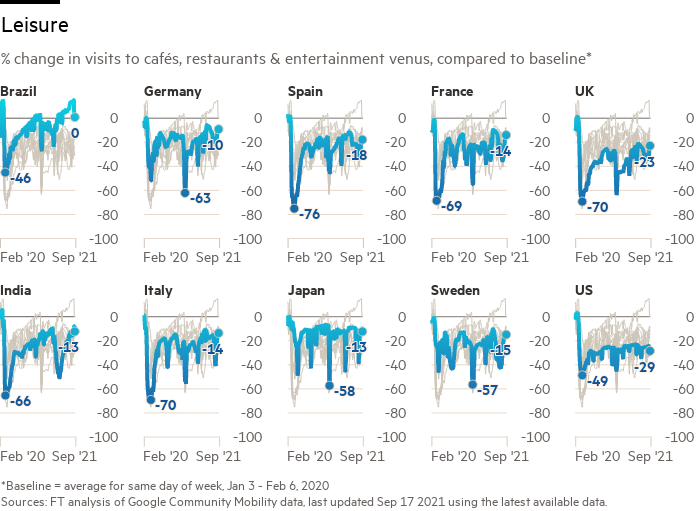
Household spending makes up the largest part of the economy in most countries, and the recovery largely depends on consumers regaining the confidence to increase spending from ultra-low levels.
Google Mobility data — which track footfall traffic — from retail and entertainment hubs is considered a proxy for consumer spending. It shows that after an initial uptick, fewer people are visiting crowded locations as case counts rise in many countries.
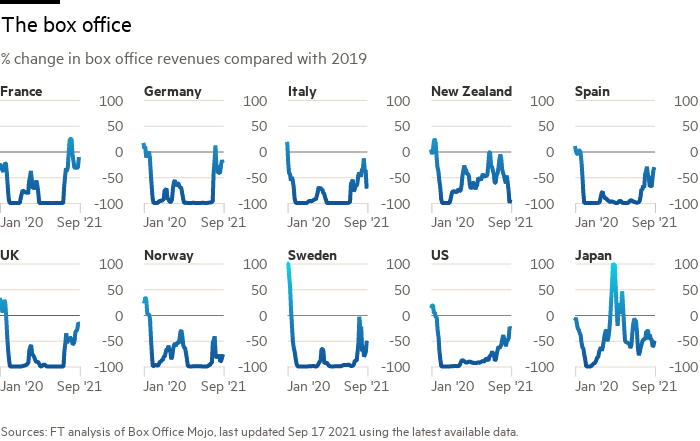
Cinemas tell a similar story. After a gradual return, visits have again dropped off in many countries where confirmed cases of the virus have risen.
EMPLOYMENT
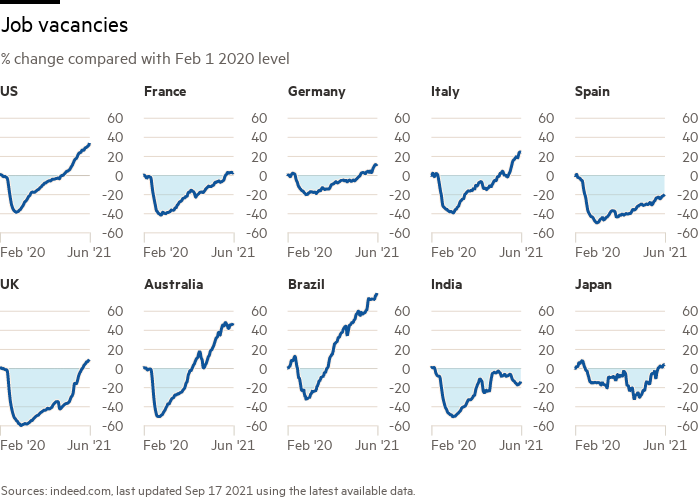
Official unemployment figures suffer from a lack of international comparability. However, other information can help shed light on the impact of the crisis — which has caused millions to lose their jobs or rely on government furlough schemes — on the employment market.
TRAVEL AND TOURISM
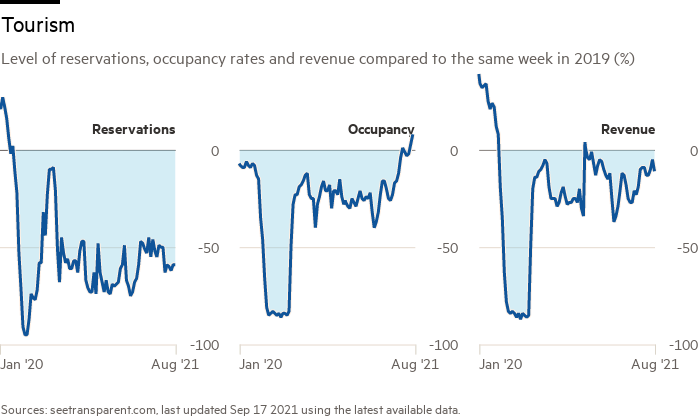
Tourism was one of the sectors hit worst by the strict lockdowns and travel bans in March and April. Global arrivals are set to shrink by between 58 and 78 per cent year on year in 2020, according to the UN World Tourism Organization. The body estimates 100m-120m direct tourism jobs are at risk.
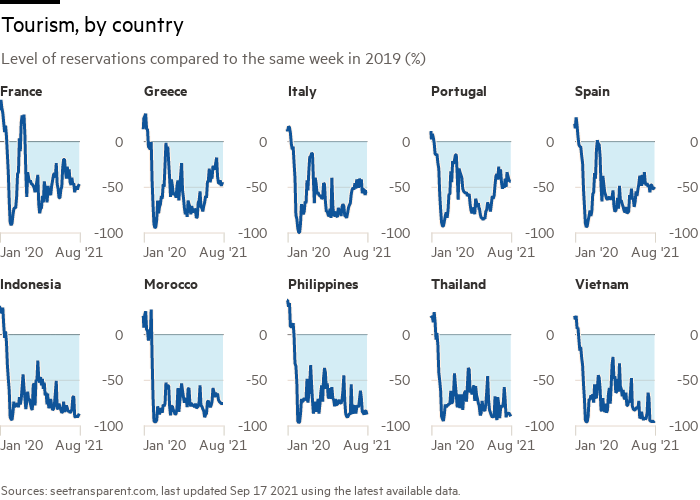
As lockdowns eased and borders began to reopen across Asia and Europe, flight and hotel occupancy data showed international mobility slowly resuming. However, the latest data from seetransparent.com suggest reservations have been hit by a resurgence of Covid-19 in many countries, with people remaining cautious about their future travel plans.
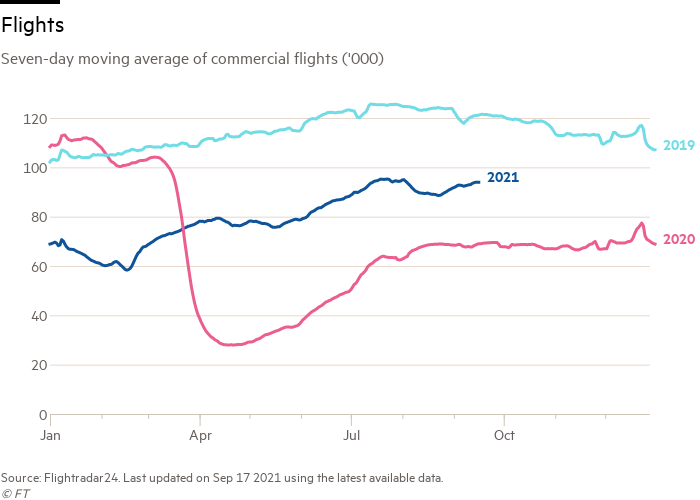
According to data published by Flightradar24 commercial air traffic volume in January was actually above the equivalent period of a year earlier. However numbers fell precipitously in late March and by early April were around a third of typical levels. Recovery has been slow, reflecting declines in both tourism and business travel during the crisis.
Reporting, data analysis and graphics by Steven Bernard, John Burn-Murdoch, Joanna S Kao, Emma Lewis, Caroline Nevitt, Alan Smith, Cale Tilford, Keith Fray and Aleksandra Wisniewska. Edited by Adrienne Klasa
Comments