China poised to pass US as world’s leading economic power this year
Simply sign up to the US trade myFT Digest -- delivered directly to your inbox.
The US is on the brink of losing its status as the world’s largest economy, and is likely to slip behind China this year, sooner than widely anticipated, according to the world’s leading statistical agencies.
The US has been the global leader since overtaking the UK in 1872. Most economists previously thought China would pull ahead in 2019.
The figures, compiled by the International Comparison Program hosted by the World Bank, are the most authoritative estimates of what money can buy in different countries and are used by most public and private sector organisations, such as the International Monetary Fund. This is the first time they have been updated since 2005.
After extensive research on the prices of goods and services, the ICP concluded that money goes further in poorer countries than it previously thought, prompting it to increase the relative size of emerging market economies.
The estimates of the real cost of living, known as purchasing power parity or PPPs, are recognised as the best way to compare the size of economies rather than using volatile exchange rates, which rarely reflect the true cost of goods and services: on this measure the IMF put US GDP in 2012 at $16.2tn, and China’s at $8.2tn.

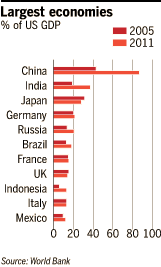
In 2005, the ICP thought China’s economy was less than half the size of the US, accounting for only 43 per cent of America’s total. Because of the new methodology – and the fact that China’s economy has grown much more quickly – the research placed China’s GDP at 87 per cent of the US in 2011.
For 2011, the report says: “The US remained the world’s largest economy, but it was closely followed by China when measured using PPPs.”
China’s crisis is coming – the only question is how big it will be
Financial crisis in China has become inevitable. If it happens soon, its effects can be contained. But, if policy makers use further doses of stimulus to postpone the day of reckoning, a severe collapse will become unavoidable within a few years.
The country is in the middle of by far the largest monetary expansion in history. On one widely used measure, M2, its money supply has tripled in the past six years, an expansion four times as large as that of the US over the same period.
Continue reading
With the IMF expecting China’s economy to have grown 24 per cent between 2011 and 2014 while the US is expected to expand only 7.6 per cent, China is likely to overtake the US this year.
The figures revolutionise the picture of the world’s economic landscape, boosting the importance of large middle-income countries. India becomes the third-largest economy having previously been in tenth place. The size of its economy almost doubled from 19 per cent of the US in 2005 to 37 per cent in 2011.
Russia, Brazil, Indonesia and Mexico make the top 12 in the global table. In contrast, high costs and lower growth push the UK and Japan further behind the US than in the 2005 tables while Germany improved its relative position a little and Italy remained the same.
The findings will intensify arguments about control over global international organisations such as the World Bank and IMF, which are increasingly out of line with the balance of global economic power.

When looking at the actual consumption per head, the report found the new methodology as well as faster growth in poor countries have “greatly reduced” the gap between rich and poor, “suggesting that the world has become more equal”.
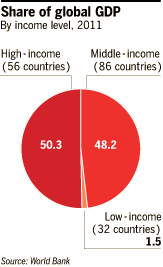
The world’s rich countries still account for 50 per cent of global GDP while containing only 17 per cent of the world’s population.
Having compared the actual cost of living in different countries, the report also found that the four most expensive countries to live in are Switzerland, Norway, Bermuda and Australia, with the cheapest being Egypt, Pakistan, Myanmar and Ethiopia.
Comments