How accurate are the Brexit polls?
Roula Khalaf, Editor of the FT, selects her favourite stories in this weekly newsletter.
Days away from Britain’s historic EU referendum, opinion polls are dominating the debate, ramping up uncertainty about the eventual outcome.
The problem is no one knows how much to trust such surveys.
A week ago, the campaign to remain in the bloc was relatively confident, buoyed by a series of polling leads; since then the Leave camp has pulled ahead in some polls.
But whether such changes are due to genuine shifts in public opinion or to the failings of an industry in crisis is a subject of intense debate.
Pollsters’ inability to predict the Conservative overall majority in the UK’s 2015 general election was just the highest profile recent mishap in countries ranging from Canada to Israel and Turkey.
Even as the June 23 referendum approaches, the industry has still to resolve big questions over the disparities between telephone and internet research and assessing people’s likelihood of voting. But alternative forms of prediction have problems of their own.
Online vs Telephone
In telephone interviews, respondents are asked whether the UK should remain part of the EU or leave. They can say they don’t know or would prefer not to say (PNTS), but since neither of these responses is explicitly stated as part of the question, there is an invisible nudge to lean one way or the other.
Online, the alternative options have to be explicitly included in the poll as it appears on screen, meaning the tentative Remains and Leaves of the telephone poll often turn into more comfortable Don’t Knows or PNTSs.
There is no intent to elicit different responses, but this appears to be what has been happening.
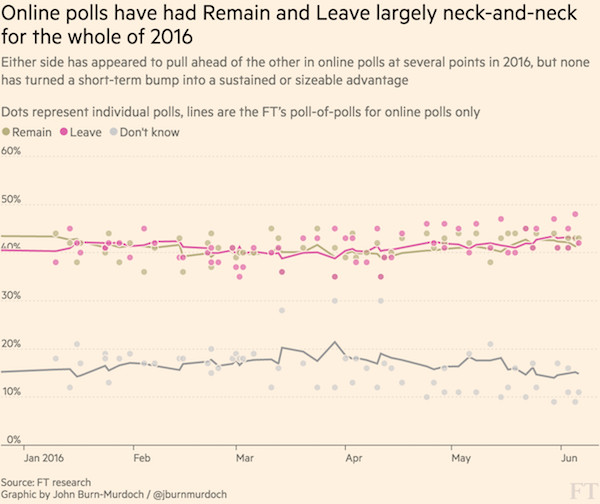
Online only, Remain and Leave have remained largely neck-and-neck throughout 2016. Small shifts either way are probably noise rather than signal.
Telephone only, Remain has held a solid lead over Leave throughout 2016. The margin tightened in the first three months of the year, but since mid-April has been largely unchanged
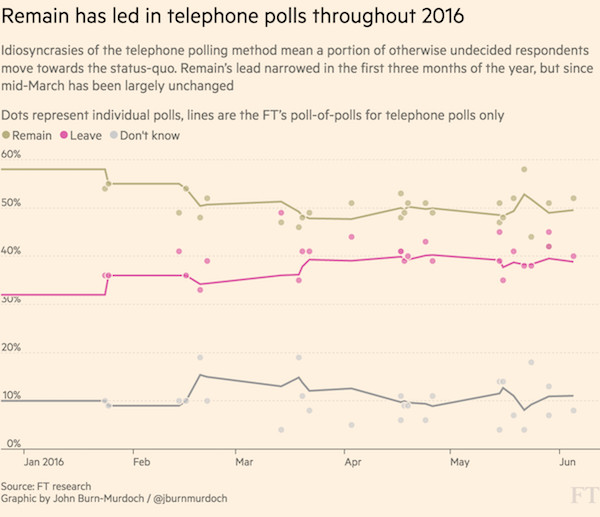
Why would Remain appear to benefit from a methodological issue concerning undecided voters? The accepted wisdom is that when respondents feel that invisible nudge to go one way or the other, they are most likely to opt for the familiarity of the status quo.
Essentially this creates two distinct data series. Unsurprisingly, increasing the frequency of telephone polls shifts the average towards Remain.
Between May 15 and 24, six out of 10 polls were carried out by telephone and Remain’s average lead widened accordingly. Some misinterpreted this as a fundamental shift indicative of changing or settling opinions among the electorate, but the movement within polls of each mode was minimal.
Polls of polls
Such factors have consequences for polls of polls, such as the Financial Times’ Brexit poll tracker.
The methodology for our poll tracker is straightforward. We take the seven most recent polls from seven different pollsters, remove outliers by dropping the poll with the highest share for Remain and the one with the lowest, and adjust for how recent the data were.
One question we are considering is whether to balance the results between telephone and online polls — which are more frequent because they are cheaper and easier to carry out, and which therefore outweigh telephone surveys.
Likelihood to vote
The online versus telephone polling problem is the most visible challenge pollsters have faced, but far from the only one. Another issue concerns likelihood of voting. This is a longer-running concern and one all pollsters adjust for, but these adjustments are far from an exact science: many different solutions are used.
Some pollsters only include answers from respondents who declare themselves certain to vote in the referendum, others weight the responses according to where respondents place themselves on a likelihood scale from 1 to 10, and others exclude anyone who puts themselves as less than 50 per cent likely to vote.
Our own analysis of the last five polls from pollsters who publish respondents’ likelihood of voting on such a scale shows how the different approaches can affect the numbers. Generally the more certain someone is that they will vote in the referendum, the more likely they are to respond “Leave”. Leave consistently does best when only those absolutely certain to vote are counted.
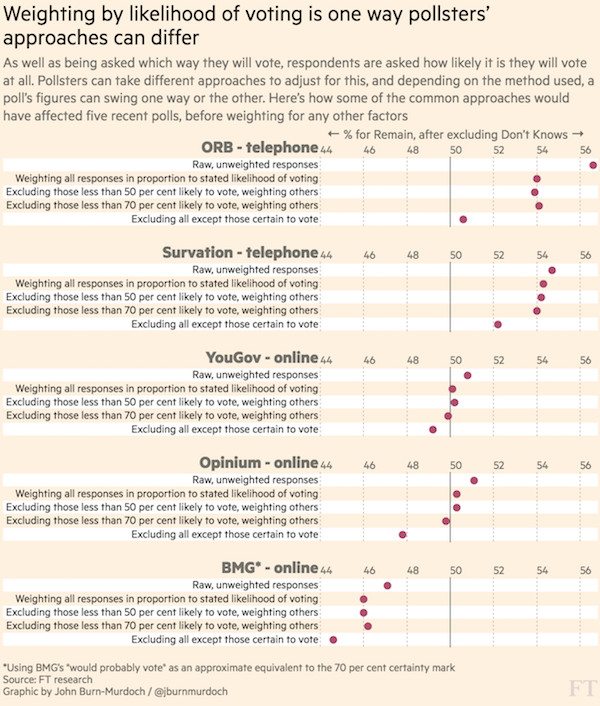
But in most cases Remain wins out among those saying they are 80 or 90 per cent certain of voting, so it is not as simple as saying Leave supporters are more likely to vote. Turnout is more likely to split down traditional demographic lines, which are finely balanced, with Leave-favouring over-50s and Remain-favouring ABC1 social grades both typically high turnout groups.
Herding
Another factor sometimes behind pollsters’ methodological tweaks is an effort to minimise the distance between their polls’ results and the perceived “true” state of the electorate’s opinion. This attempt to position a poll in the middle of the pack is known as “herding”.
A convergence of the Remain and Leave numbers — consistent with what would result from herding — has been identified in EU referendum polls over the past year by Professors Patrick Sturgis and Will Jennings, both of whom contributed to the inquiry into polling ahead of the 2015 general election.
The betting markets
With so many problems afflicting the polls, some suggest turning to the betting markets instead. The argument is that a prediction made in the hope of earning a reward will be a good indicator of the way things will go.
There are problems here, too. Most obviously, much of the money that moves the betting markets will have been placed with the polls as a guide.
We can see this at work in what happened to the betting markets during the lead-up to the general election in May 2015.
Based on the average odds across mainstream bookmakers, the Conservatives began to open up a lead in February 2015 over Labour in terms of implied likelihood of being the party with the most seats, but the gap didn’t become a yawning gulf until only the final fortnight before election day.
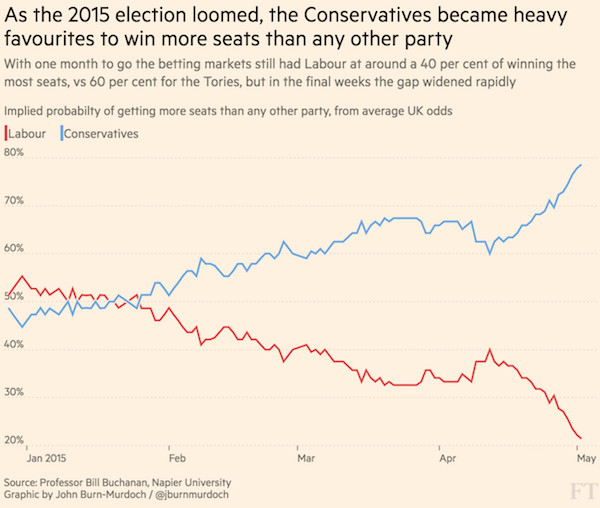
Even then, just five days before polls opened, odds in a separate market implied a 91 per cent probability of there being no overall majority in the House of Commons. Six days later the Tories had won 330 of the 650 seats — a narrow overall majority but an overall majority nonetheless.
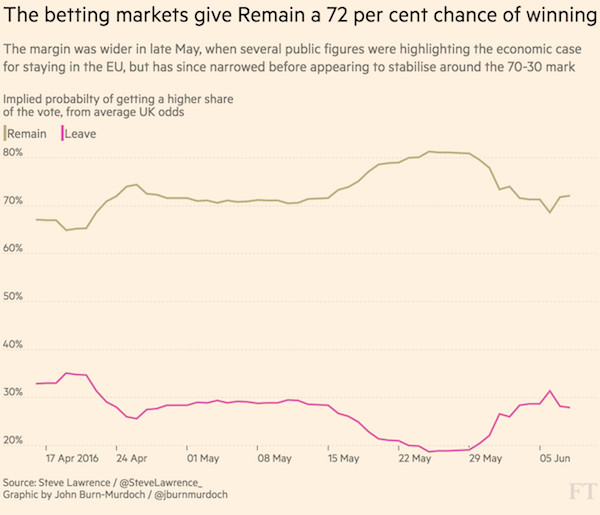
At the time of writing, the odds imply a 72 per cent chance of Remain winning the day. In short, the bookies are confident that the UK will remain part of the EU, but less confident than they were that there would be no overall majority last May.
Comments